What is inflation?
Prices rarely rise all at once or by the same amount. Statisticians turn millions of price tags into one number — here is how to read it.

On this page
- Inflation is a broad, sustained rise in the prices of goods and services, so each unit of money buys a little less over time.
- In the US it is most often reported through the Consumer Price Index (CPI); the euro area uses the Harmonised Index of Consumer Prices (HICP).
- US CPI inflation was 3.4% in the 12 months to August 2026; euro area HICP inflation was 3.2% over the same period.
- The Federal Reserve and the European Central Bank both aim for 2% inflation, measured with different indexes.
- Savings earning less than the inflation rate lose purchasing power even when the account balance grows.
Inflation is a general rise in prices across an economy, which means a unit of money buys less than before. It is usually measured as the yearly percentage change in a consumer price index, such as the US CPI or the euro area's HICP.
What does inflation actually mean?
Inflation is not one price going up. A pricier phone or a bad harvest that lifts coffee prices is a relative price change. Inflation is the broad drift upward in the prices of most things people buy, so that the same amount of money covers less than it used to. The European Central Bank puts it simply: with inflation, one euro buys less today than it did yesterday.
The flip side of rising prices is falling purchasing power. If prices rise 3% in a year, $100 at the end of that year buys roughly what $97 bought at the start. That is why inflation matters to anyone holding cash, receiving a fixed pension or comparing the interest on a savings account. You can test your own numbers with our inflation calculator.
When prices fall across the board, the opposite happens. The IMF notes that this deflation can lead people to delay purchases, which tends to weigh on growth — one reason central banks aim for low positive inflation rather than zero or negative.
How is inflation measured?
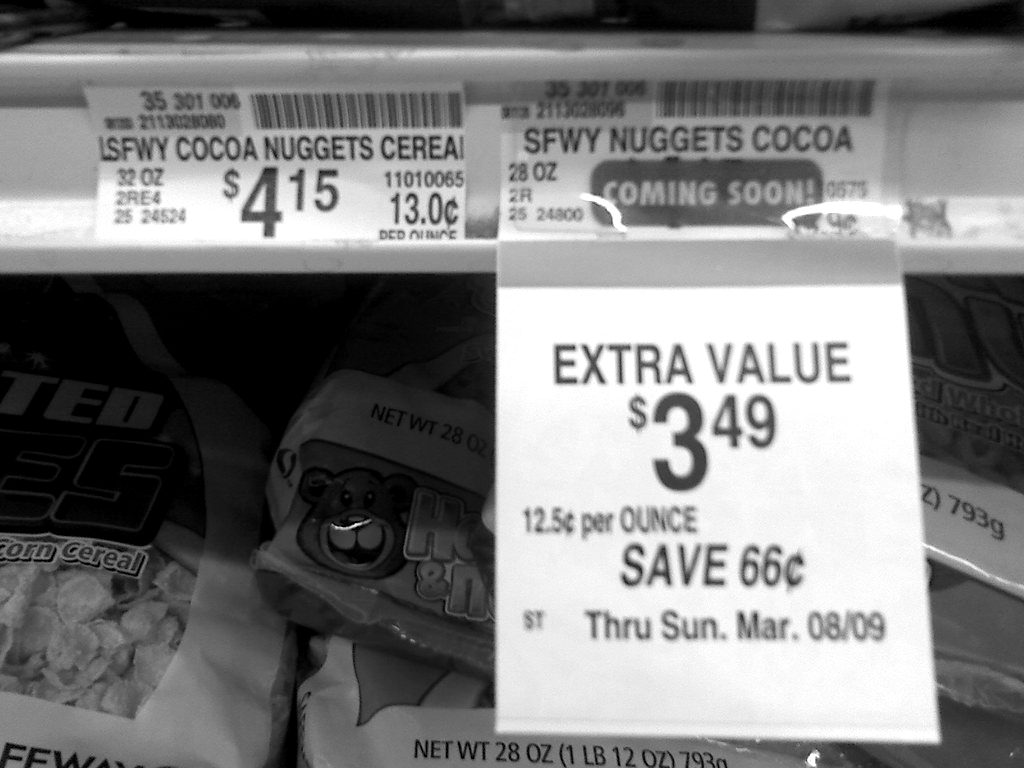
Statistics agencies track the price of a fixed basket of goods and services that represents what typical households buy, and then calculate how much that basket's cost changes over time.
Collect prices. In the US, Bureau of Labor Statistics (BLS) staff record the prices of about 80,000 items every month in stores, service businesses and online.
Weight them. Items count in proportion to how much households spend on them, so a big monthly expense moves the index far more than a minor one.
Build an index. Most CPI series are set so that the average of 1982–84 equals 100. An index of 310 means the basket costs 3.1 times what it did then.
Compare over time. The inflation rate is the percentage change in the index, usually versus the same month a year earlier.
The euro area does the same with the HICP, which Eurostat compiles from national price data and weights each country by its share of euro area consumer spending.
Which inflation measures should you know?
Several indexes exist because they answer slightly different questions. The headline number in the news is usually the first one in the table.
| Measure | What it covers | Why it matters |
|---|---|---|
| CPI-U (US BLS) | Urban consumers — over 90% of the US population | The main US headline figure |
| CPI-W (US BLS) | Wage earner and clerical households — about 30% of the population | Tracks a narrower group of households |
| Core CPI (US BLS) | CPI excluding food and energy | Strips out the most volatile items to show the underlying trend |
| PCE price index (US) | Personal consumption spending; adapts faster as spending patterns shift | The measure behind the Fed's 2% goal |
| HICP (Eurostat) | Household consumption across euro area countries | The measure behind the ECB's 2% target |
In August 2026, US headline CPI rose 3.4% over twelve months while core CPI rose 2.4%. Most of the gap reflects energy, whose index was up 16.3% — a reminder of why analysts look at core measures alongside the headline.
What causes inflation?
There is no single cause, and economists still argue about how much each factor matters in a given episode. The IMF's introductory guide groups the usual suspects like this:
- Demand-pull. Spending grows faster than the economy can produce, so sellers can raise prices.
- Cost-push. Production costs jump — energy, raw materials, supply disruptions — and firms pass them on.
- Expectations. If people expect higher prices, they ask for higher wages and write price rises into contracts, which can make inflation self-reinforcing.
- Money growth. Too much money chasing the same output can erode the value of each unit of currency.
Central banks mainly respond through interest rates. The Federal Reserve explains that its policy rate influences other borrowing costs, spending and hiring, with effects that are neither direct nor immediate. We explain the knock-on effects for investors in how interest rates affect stocks, bonds and crypto.
Who wins and who loses from inflation?
Inflation redistributes purchasing power. According to the IMF, people whose wages lag behind prices and retirees on fixed payments lose ground, while borrowers on fixed-rate loans can gain, because they repay with money that is worth less.
For savers, the key figure is the real return: the interest rate minus inflation. A savings account paying 1.5% while prices rise 3.4% leaves you about 1.8% poorer in purchasing power over the year (1.015 ÷ 1.034 − 1 ≈ −1.84%), even though the balance went up. Over long periods the effect compounds: at a steady 3% a year, prices rise by about 34% in a decade. Our compound interest calculator shows the same math working in the other direction.
Some people buy crypto-assets because of inflation fears. Bitcoin's software caps its supply at 21 million coins, as explained in what is bitcoin, but a fixed supply does not make a price stable: the SEC's chair described bitcoin in 2024 as primarily a speculative, volatile asset. Stablecoins pegged to the dollar simply inherit dollar inflation — see what is a stablecoin.

What mistakes do people make when reading inflation numbers?
- Confusing the inflation rate with the price level. Inflation falling from 4% to 3% means prices are still rising, just more slowly. It does not mean prices are going back down.
- Mixing monthly and yearly figures. The 0.4% rise in US CPI for August 2026 is a one-month, seasonally adjusted change; the 3.4% figure covers twelve months.
- Comparing different indexes. US CPI, US PCE and euro area HICP use different baskets and methods. Compare like with like.
- Ignoring the date. A new inflation figure replaces the last one every month. Always check the reference month — the BLS publishes September 2026 CPI on 14 October 2026.
- Treating your nominal balance as your wealth. What matters is what the money can buy.
Questions readers ask
What is a normal inflation rate?
There is no universal normal, but the Federal Reserve and the European Central Bank both target 2% a year. The ECB says its target is symmetric, meaning it treats undershooting and overshooting as equally undesirable.
What is core inflation?
Core inflation removes food and energy prices, which tend to jump around, to show the underlying trend. In the US, core CPI rose 2.4% in the 12 months to August 2026, versus 3.4% for all items.
Why does my personal inflation feel higher than the official number?
The official index reflects an average basket. If you spend more than average on items rising fastest, such as energy, your experience differs. The ECB also notes people tend to notice price rises more than stable or falling prices.
Is deflation better than inflation?
Not usually. Broadly falling prices can lead people to postpone spending, which can weaken the economy. That is one reason central banks aim for low, positive inflation.
Inflation is the steady erosion of what money buys, measured by tracking a weighted basket of prices. To read the numbers well, check which index is quoted, whether the change is monthly or yearly, and which month it describes. Then compare it with the interest you earn: the real return is what tells you whether your savings are keeping up.
Sources
- US Bureau of Labor Statistics, Consumer Price Index — August 2026 (news release) (2026)Primary source
- US Bureau of Labor Statistics, Consumer Price Index: Frequently Asked Questions (2026)Primary source
- Eurostat, Euro area annual inflation — August 2026 (2026)Primary source
- Board of Governors of the Federal Reserve System, What is the Fed's inflation goal? (2024)Primary source
- Board of Governors of the Federal Reserve System, Economy at a Glance — Inflation (PCE) (2024)Primary source
- Board of Governors of the Federal Reserve System, How does monetary policy influence inflation and employment? (2024)Primary source
- European Central Bank, The ECB's monetary policy strategy (2021)Primary source
- European Central Bank, What is inflation? (2024)Primary source
- International Monetary Fund, Finance & Development, Inflation: Prices on the Rise (Back to Basics) (2012)Primary source
- bitcoin.org, Bitcoin FAQ (2024)Primary source
- US Securities and Exchange Commission, Statement on the Approval of Spot Bitcoin Exchange-Traded Products (2024)Primary source
Educational content only — not financial, investment, legal or tax advice. Crypto-assets are high-risk and you could lose all the money you put in. Rules differ by country; check with your national regulator. See our risk disclosure and editorial policy.
Read next
- Markets & Macro · Intermediate
How interest rates affect markets
From the policy rate to bond prices, share prices and crypto: what is established and what is debated.
- Tools · Calculator · Beginner
Inflation and purchasing power calculator
How much a sum loses in buying power at a steady yearly inflation rate, with the formula.
- Stablecoins & Payments · Beginner
What is a stablecoin?
Tokens designed to stay at $1: what backs them, how redemption works, and why runs happen.
- Glossary · Definition · Beginner
APR vs APY
Simple rate versus compounded yield, with the official formula and a worked example.